
PivotTables allow you to quickly summarize and analyze Excel data without changing the original dataset or writing complex formulas. Microsoft Excel is commonly used to store business information such as sales transactions, customer records, expenses, and project data. But as a worksheet grows, it can become difficult to analyze all that information efficiently.
PivotTables help organize and summarize the data, making it easier to create useful reports and identify important insights.
Suppose you have hundreds of sales transactions and want to answer questions such as:
Which region generated the most sales?
Which customer segment generated the most revenue?
Which region generated the highest profit?
You could create formulas to answer each question individually.
Or you could use a PivotTable.
In this article, we'll use a sample Orders dataset to create PivotTables and answer several practical business questions.
What Is a PivotTable in Excel?
A PivotTable is an Excel tool used to summarize and analyze data.
Imagine that your worksheet contains individual customer orders. Each row representing a transaction. Looking through individual rows may help you find a particular transaction, but it doesn't quickly tell you: How much did each region sell?
A PivotTable can group the transactions by Region and calculate the total Sales for each one.
You can then rearrange the same data to analyze sales by customer segment, compare sales across regions, or answer other business questions.
That flexibility is what makes PivotTables useful for everyday data analysis.
Prepare Your Data for a PivotTable
Before creating a PivotTable, make sure the source data is organized properly.
Data used to create a PivotTable should have the following characteristics:
Each column should have a header
Each row should contain one record
There should be no blank rows within the dataset
Each column should contain a consistent type of information
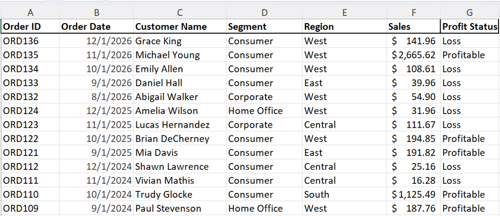
· For our examples, we'll use the Orders dataset shown below:
How to Create a PivotTable in Excel
Follow these steps to create a PivotTable in Excel:
Click anywhere inside the Orders dataset.
From the ribbon, go to Insert Tab and select PivotTable
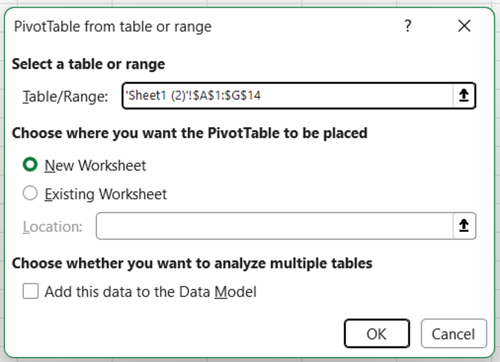
The PivotTable from table or range dialog box will appear. Check that the correct data range has been selected and select New Worksheet as shown in the figure below:
Click OK.
This will create a new worksheet with an empty PivotTable.
You see the PivotTable interface below. It also displays the PivotTable Fields pane on the right.
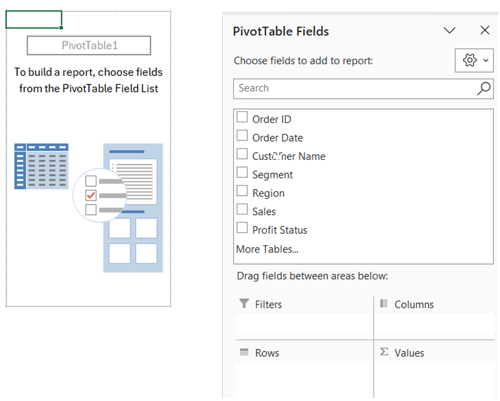
The PivotTable Fields pane displays the fields from your source data and four areas where those fields can be placed: Filters, Columns, Rows, and Values.
The fields you select or drag into these areas determine how Excel organizes and summarizes the data in the PivotTable.
Understanding Rows, Columns, Values, and Filters
Before building our first analysis, it is important to understand the four areas of the PivotTable Fields pane (shown in the figure above)
Rows
Fields placed in Rows appear vertically in the PivotTable. For example, placing Region in Rows creates a separate row for each region.
Columns
Fields placed in Columns create categories across the top of the PivotTable.
Values
Values contain the numbers you want Excel to summarize. For example, placing Sales in Values allows Excel to calculate total sales.
Filters
Filters allow you to limit the PivotTable to particular information.
For beginners, a simple way to think about a PivotTable is:
What do I want to compare?
and
What number do I want Excel to calculate?
Let's apply that idea to our data.
Example 1: Calculate Total Sales by Region
Suppose management asks:
Which region generated the most sales?
We need to compare Region, and the number we want to calculate is Sales.
In the PivotTable Fields pane, drag:
Region to Rows
Then drag:
Sales to Values
Excel summarizes all the individual orders and calculates total sales for each region.
The PivotTable should show approximately:
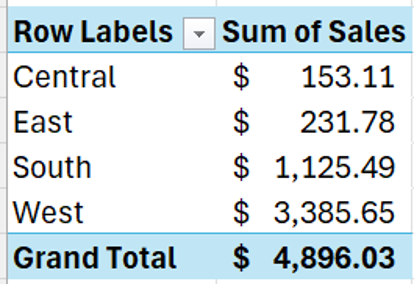
From the PivotTable, we can immediately see that the West region generated the highest sales in this sample dataset.
Instead of manually calculating four separate totals, the PivotTable created the entire summary for us.
Note: If the Sales values don't appear as currency, right-click one of the values and select:
Value Field Settings → Number Format → Currency
Formatting the field this way makes the results easier to read.
Example 2: Compare Sales by Customer Segment
Now let's answer another business question:
Which customer segment generated the most sales?
The dataset contains customer segments such as Consumer, Corporate, and Home Office.
Note: For this exercise, you can either create a new PivotTable or uncheck Region in the existing PivotTable fields.
This time, use:
Segment to Rows
Sales to Values
The PivotTable should show approximately:
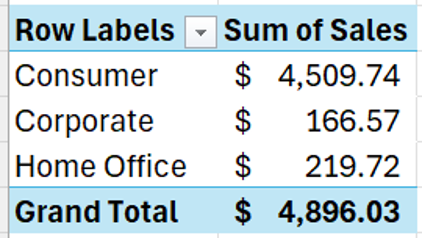
The Consumer segment generated the highest sales in the sample dataset.
Notice what we changed.
In the first example, we analyzed Sales by Region.
In the second example, we analyzed the same Sales field by Segment.
We didn't need to change the original data or create another formula.
We simply changed how the data was organized.
This is one of the main advantages of using PivotTables.
Common PivotTable Mistakes to Avoid
PivotTables are relatively easy to create, but beginners may encounter a few common problems.
Excel Shows Count Instead of Sum
You may drag Sales into Values and see Count of Sales instead of Sum of Sales.
This can happen when Excel doesn't recognize all the values in the source column as numbers.
Check the source data to make sure the Sales values are stored correctly as numbers.
You can also open Value Field Settings and select Sum when appropriate.
Numbers Aren't Formatted Correctly
Sales and Profit may appear as regular numbers instead of currency.
Use:
Value Field Settings → Number Format
to apply the appropriate format.
The Source Data Isn't Organized Properly
PivotTables work best with structured data.
Make sure every column has a heading and each row represents one record. Avoid completely blank rows or columns within the dataset.
Using the Wrong Calculation
PivotTables can calculate more than totals.
Depending on the field, Excel can use calculations such as Sum, Count, Average, Maximum, or Minimum.
Always make sure the calculation answers the business question you're trying to solve.
PivotTables and Excel Formulas Work Together
PivotTables don't replace Excel formulas. They solve a different type of problem.
Functions such as IF, SUMIFS, COUNTIFS, XLOOKUP, and IFERROR can help you calculate, classify, retrieve, and validate information within a worksheet. These are also the functions covered in our earlier Excel article.
PivotTables are particularly useful when you want to summarize and compare groups of data.
For example, you could use SUMIFS to calculate Sales for a particular region.
A PivotTable can quickly display Sales for all regions at once.
Both approaches are valuable Excel skills.
For practical examples of commonly used Excel formulas, read 5 Excel Functions Every Professional Should Know.
Practice What You Learned
Now use the Orders dataset and try creating PivotTables to answer these three questions yourself.
1. Which region generated the highest Sales?
Use:
Region to Rows
Sales to Values
2. Which customer segment generated the highest Sales?
Use:
Segment to Rows
Sales to Values
3. Which Customer generated the highest Sales?
Use:
Customer Name to Rows
Sales to Values
The objective isn't simply to get the correct answer.
Practice identifying:
What do I want to compare?
and
What value needs to be calculated?
Once you can answer those questions, building a basic PivotTable becomes much easier.
Final Thoughts
PivotTables are one of the most useful Excel tools for summarizing and analyzing business data.
Start with simple questions.
What are Sales by Region?
Which customer segment generated the most Sales?
Which customer generated the higest Sales?
Once you understand how to place fields into Rows, Columns, Values, and Filters, you can begin using PivotTables to answer many different business questions.
You don't need to learn every PivotTable feature at once.
Start with the fundamentals, practice with realistic data, and gradually build your skills.
As your data analysis requirements become more complex, you may also want to explore how Excel compares with Power BI.
Read Excel vs. Power BI: Which One Should You Learn First?
Professionals who want structured, hands-on practice with PivotTables, formulas, data analysis, and other Excel features can explore Microsoft Excel Training at Ohio Computer Academy
Frequently Asked Questions
What is a PivotTable used for in Excel?
A PivotTable is used to summarize and analyze data. It can quickly calculate totals, counts, averages, and other measures across categories such as regions, customer segments, products, or dates.
Are PivotTables difficult for beginners to learn?
Basic PivotTables are relatively easy to learn once you understand Rows, Columns, Values, and Filters. A good starting point is creating a simple PivotTable that summarizes Sales by Region.
Do I need to know Excel formulas before learning PivotTables?
No. You can create useful PivotTables without knowing advanced Excel formulas. However, formulas and PivotTables complement each other, so learning both can improve your Excel data-analysis skills.
What is the difference between a PivotTable and SUMIFS?
SUMIFS calculates a total based on criteria specified in a formula. A PivotTable can summarize multiple categories at once and allows you to rearrange the analysis without rewriting formulas.
Why does my PivotTable show Count instead of Sum?
Excel may use Count when the source field contains text or values Excel doesn't recognize as numeric. Check the source column and make sure the values are stored as numbers. You can also use Value Field Settings to select the appropriate calculation.
Should I learn PivotTables before Power BI?
PivotTables provide a useful foundation for learning how to summarize, group, and analyze business data. Power BI adds capabilities such as data modeling, Power Query, DAX, and interactive reporting. The best starting point depends on the type of work you need to perform.

Chandraish Sinha is the Founder and President of Ohio Computer Academy, a leading institution committed to delivering high-quality IT education. With a passion for teaching and a belief in his company’s mission—Inspire, Educate & Evolve—Chandraish brings over 25 years of experience in the Information Technology industry.
Explore more of his work on his Amazon Author Profile.
0 Comments
0 Comments



Post a Comment