
If you're planning to improve your data analysis skills or start a career in business intelligence, you've probably asked yourself this question:
Should I learn Microsoft Excel or Power BI?
It's a common question—and an important one.
Both Excel and Power BI are developed by Microsoft and are widely used by organizations around the world. While the two tools share some similarities, they are designed for different purposes.
Excel is used by millions of professionals every day for calculations, budgeting, reporting, forecasting, and organizing information.
Power BI, on the other hand, is a modern business intelligence and visualization platform that transforms large volumes of data into interactive dashboards and visual reports.
Rather than thinking of these tools as competitors, it's more helpful to see them as complementary technologies. In many organizations, employees use Excel for everyday analysis and Power BI to create dashboards that executives and business teams can access and share.
In this article, we'll compare Excel and Power BI, explore where each tool excels, and help you determine which one you should learn first based on your career goals.
What is Microsoft Excel?
Microsoft Excel is an essential tool for professionals across virtually every industry.
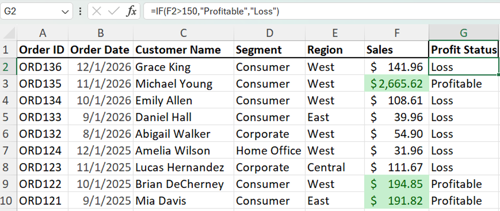
Figure: Microsoft Excel showing Formula and Conditional Formatting
Advantages of Excel.
Creating spreadsheets
Performing calculations using formulas and functions
Cleaning and organizing data
Creating PivotTables
Developing charts and graphs
Budgeting and forecasting
Building dashboards
Automating repetitive work using macros and Power Query
Because Excel is easy to learn and extremely versatile, it is often the first analytical tool professionals encounter during their careers.
One of Excel's biggest strengths is its flexibility and ease of learning.
Limitations of Excel
Although Excel is incredibly powerful, it does have limitations.
· As datasets become larger, spreadsheets can become difficult to manage.
· Multiple users editing the same workbook may create version control issues,
· Sharing reports often requires emailing updated files.
These challenges become more significant when organizations need to analyze millions of records or create dashboards that automatically refresh with new data.
That's where Power BI comes in.
New to Excel? Explore our Microsoft Excel Training to build practical skills in formulas, PivotTables, dashboards, and workplace productivity.
What is Microsoft Power BI?
Microsoft Power BI is Microsoft's business intelligence and data visualization platform.
Unlike Excel, which focuses primarily on spreadsheets, Power BI is designed to help organizations combine data from multiple sources, analyze trends, and create interactive dashboards that can be shared across teams.
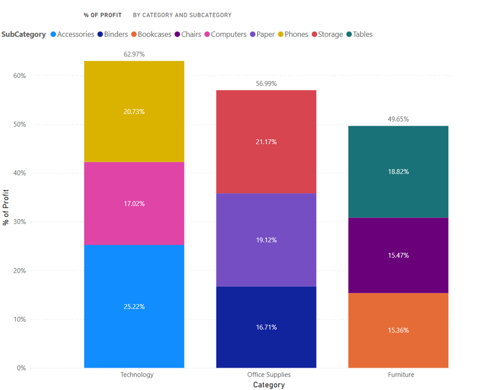
Microsoft Power BI KPI visualization
Power BI connects to a wide range of data sources, including:
Excel workbooks
SQL Server databases
Oracle databases
Azure services
SharePoint
Salesforce
CSV files
Web APIs
Cloud applications
Instead of manually updating reports each week, Power BI can automatically refresh data and display the latest information through dynamic dashboards.
For example, a sales manager might open a Power BI dashboard every morning to instantly see:
Today's sales
Monthly revenue
Top-performing products
Regional performance
Customer trends
Profit margins
Rather than scrolling through multiple spreadsheets, all key business metrics are available in one interactive dashboard.
Power BI also allows users to drill down into data. A manager can start by viewing company-wide sales, then click on a region, a salesperson, or even an individual customer to explore more detailed information.
Advantages of Power BI
Handles very large datasets efficiently
Creates interactive dashboards
Connects to multiple data sources
Supports automated data refresh
Makes report sharing easier across teams
Strong data visualization capabilities
Excellent for executive reporting and business intelligence
Limitations of Power BI
Although Power BI is extremely powerful, it isn't intended to replace Excel.
Simple calculations, quick data entry, budgeting, and one-off analyses are often easier to perform in Excel.
Power BI also has a steeper learning curve because users need to understand concepts such as data modeling, relationships, Power Query, and DAX (Data Analysis Expressions).
For most professionals, learning Excel first provides a solid foundation before moving on to Power BI.
Ready to build interactive dashboards? Explore our Microsoft Power BI Training to learn data modeling, visualizations, DAX, and real-world reporting techniques.
Excel vs. Power BI: Feature Comparison
Feature | Microsoft Excel | Microsoft Power BI |
Primary Purpose | Spreadsheet and data analysis | Business intelligence and interactive dashboards |
Best For | Individual analysis and reporting | Organization-wide reporting and analytics |
Data Size | Small to medium datasets | Medium to very large datasets |
Dashboards | Basic dashboards | Advanced interactive dashboards |
Charts | Excellent | Excellent with advanced visuals |
Data Sources | Primarily spreadsheet-based | Multiple databases and cloud sources |
Automation | Power Query, VBA | Power Query, scheduled refresh |
Collaboration | Shared workbooks | Cloud-based sharing and collaboration |
Learning Curve | Beginner-friendly | Moderate |
Typical Users | Business professionals, analysts, accountants | Data analysts, BI developers, managers, executives |
Which Tool Should You Choose?
If your daily work involves creating spreadsheets, performing calculations, budgeting, or analyzing moderate amounts of data, Excel is an excellent choice.
If you need to combine information from multiple systems, create interactive dashboards, monitor key performance indicators (KPIs), or share reports across your organization, Power BI is the stronger solution.
The most successful professionals don't choose one tool over the other—they learn how to use both together. Excel provides the foundation for data analysis, while Power BI extends those skills into modern business intelligence and enterprise reporting.
Should You Learn Excel Before Power BI?
This is the question most people ask.
The short answer is:
Learn Excel first. Then learn Power BI.
There are several reasons why this approach works best.
1. Excel Builds Strong Data Skills
Before creating dashboards, it's important to understand the data itself.
Excel teaches you how to:
Organize information
Write formulas
Analyze trends
Clean messy data
Use logical functions
Build PivotTables
Interpret business reports
These are essential analytical skills that carry over into Power BI.
2. Many Power BI Projects Start with Excel
A surprising number of organizations still store their business data in Excel workbooks.
Power BI often imports information from Excel before transforming it into interactive dashboards.
If you're comfortable working with Excel, you'll have an easier time understanding how Power BI processes and visualizes data.
3. Employers Often Expect Both Skills
Many job postings don't ask for just Excel or just Power BI.
Instead, they list both as preferred skills.
Professionals who understand both tools are often more valuable because they can prepare the data in Excel and present it effectively using Power BI.
4. The Learning Curve Becomes Easier
Power BI introduces concepts such as:
Data relationships
Data modeling
Power Query
DAX calculations
Interactive filtering
These concepts are easier to understand when you already have experience working with data in Excel.
Learning Excel first creates a strong foundation and reduces the learning curve when you move to Power BI.
Frequently Asked Questions
1. Can I learn Power BI without learning Excel?
Yes, you can learn Power BI without first mastering Excel. However, having a solid understanding of Excel makes the learning process much easier.
Excel teaches essential skills such as working with tables, formulas, PivotTables, and data organization. These concepts provide a strong foundation for understanding Power BI's data modeling and reporting capabilities.
If you're new to data analysis or IT in general, I recommend starting with Excel before moving to Power BI.
2. Is Power BI replacing Excel?
No.
Power BI is not replacing Excel. Instead, the two tools complement each other.
Excel remains the preferred tool for tasks such as:
Data entry
Calculations
Budgeting
Financial modeling
Ad hoc analysis
Power BI is designed for:
Interactive dashboards
Business intelligence
Large datasets
Executive reporting
Data visualization
Many organizations use Excel and Power BI together as part of their reporting and analytics strategy.
3. Which tool is better for beginners?
For most beginners, Excel is the better place to start.
It is easier to learn, widely used across industries, and provides the analytical skills needed for more advanced tools like Power BI.
Once you're comfortable with Excel, transitioning to Power BI becomes much easier.
4. Do employers expect both Excel and Power BI skills?
Increasingly, yes.
Many employers look for candidates who can:
Analyze data in Excel
Create reports and dashboards in Power BI
Communicate insights to decision-makers
Having experience with both tools can make you more competitive in roles such as Data Analyst, Business Analyst, Financial Analyst, and Reporting Analyst.
5. Should I learn Excel first if I want to become a Data Analyst?
Yes.
Excel provides the foundation for many data analysis tasks, including data cleaning, calculations, and summarization.
Once you're confident with Excel, learning Power BI, SQL, and other analytics tools becomes much more manageable.
Conclusion
Microsoft Excel and Power BI are two of the most valuable tools for professionals working with data, but they serve different purposes.
Excel is the ideal choice for organizing information, performing calculations, building financial models, and conducting everyday data analysis. It is flexible, accessible, and remains one of the most widely used business applications in the world.
Power BI extends those capabilities by enabling organizations to connect multiple data sources, create interactive dashboards, and monitor business performance through real-time visualizations.
If you're just beginning your learning journey, start with Excel. Build confidence with formulas, functions, PivotTables, and data analysis techniques. Once those fundamentals are in place, Power BI becomes a natural next step, allowing you to transform data into meaningful insights that support better business decisions.
Whether you're a student, a working professional, or someone looking to advance your career, learning both Excel and Power BI can open the door to new opportunities in today's data-driven workplace.
Ready to Build Your Data Analysis Skills?
At Ohio Computer Academy, we offer instructor-led training designed for individuals, teams, and organizations.
Our hands-on courses focus on practical skills that you can apply immediately in the workplace.
Whether you're starting with Excel or ready to build interactive Power BI dashboards, our experienced instructors provide real-world examples and personalized guidance to help you succeed.
Explore our training programs:
Need help deciding which course is right for you?
Contact us today, and we'll help you choose the learning path that best matches your goals and experience.

Chandraish Sinha is the Founder and President of Ohio Computer Academy, a leading institution committed to delivering high-quality IT education. With a passion for teaching and a belief in his company’s mission—Inspire, Educate & Evolve—Chandraish brings over 25 years of experience in the Information Technology industry.
Explore more of his work on his Amazon Author Profile.
0 Comments
0 Comments


Post a Comment