
A stacked bar chart helps compare multiple measures across categories. In Tableau, you can create a stacked bar chart using Measure Names and Measure Values. However, displaying the combined total at the end of each bar requires a few additional steps.
In my other blog, I showed how to display total on a stacked bar chart in Tableau. In this tutorial, we will create a stacked bar chart using Sales and Profit from Tableau's Sample Superstore dataset. We will then add a calculated field and use a dual axis to display the combined total for each category.
Creating Stacked Bar chart with two Measures
First we will create a stacked bar chart with two measures and then we will apply Totals to it. You can use Tableau Public or desktop for this exercise.
Connect to the Sample-Super store.xls data set. Use the Orders table.
Open a new worksheet.
Drag Category to Rows.
Drag Measure Values to Columns.
Make sure Measure Names appear on the Filters.
Edit the filter and select only Sales and Profit.
Drag Measure Names to Color on the Marks card.
Place Measure Values on the Label card.
This will create a stacked bar chart with two measures - Sales and Profit.
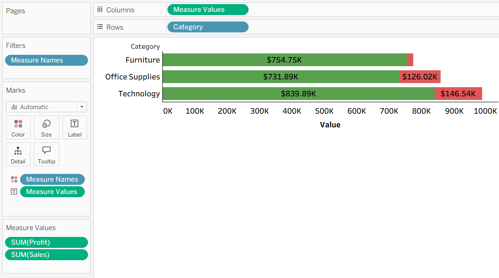
Stacked bar chart showing Sales and Profit by Category
Creating Totals on the Stacked bar chart with two measures
Now we would display the total of Sales and Profit at the end of the individual bars.
Go to Analysis (in the menu) and select Create Calculated Field.
Name the calculated field as Total Sales and Profit.
Enter the following calculation and click OK
SUM([Sales]) + SUM([Profit])
This calculation adds the aggregated Sales and Profit values for each category.
Add the Total to the Chart
Drag the calculated field Total Sales and Profit to Columns, placing it to the right of Measure Values.
Tableau initially displays a second chart.
Right-click the axis for Total Sales and Profit.
Select Dual Axis.
Right-click an axis and select Synchronize Axis.
Both charts are now displayed in the same view.
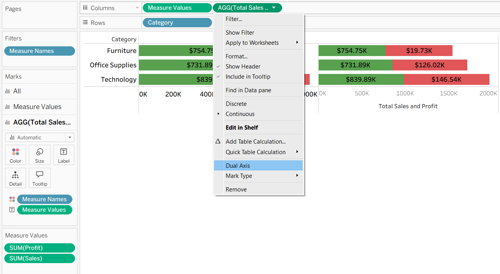
Adding a calculated total to the stacked bar chart using a dual axis.
Change the Total Marks to Circle
After creating the dual axis, Tableau displays separate Marks cards for the two axes.
On the Marks card, select Measure Values.
Set the mark type to Bar.
Select the Total Sales and Profit Marks card.
Change its mark type to Circle.
Drag Total Sales and Profit to Label on that Marks card if it is not already there.
Drag Total Sales and Profit to color.
Adjust the circle size and label alignment so the total appears clearly at the end of each bar.
Make sure Measure Names remains on Color for the stacked bars, not for the total circles.
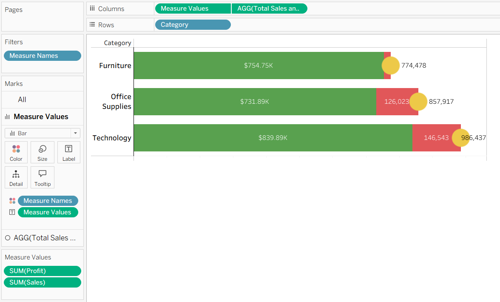
Final Tableau stacked bar chart displaying Sales, Profit, and their combined total by Category.
Conclusion
Using Measure Names and Measure Values, Tableau makes it easy to display multiple measures in a stacked bar chart. By adding a calculated field and configuring a dual axis, we can also display a combined total at the end of each bar.
This technique is useful when comparing related measures and highlighting their combined values across categories. For the most meaningful analysis, choose measures that can reasonably be added together.
Want to Learn More Tableau Techniques?
Ohio Computer Academy offers instructor-led Tableau training covering data visualization, calculations, charts, dashboards, and practical business scenarios.
Explore our Tableau training courses to strengthen your data visualization skills.

Chandraish Sinha is the Founder and President of Ohio Computer Academy, a leading institution committed to delivering high-quality IT education. With a passion for teaching and a belief in his company’s mission—Inspire, Educate & Evolve—Chandraish brings over 25 years of experience in the Information Technology industry.
Explore more of his work on his Amazon Author Profile.


Post a Comment