Tableau is a popular Business Intelligence and data visualization application. In this article we will learn how to create your first Tableau Visualization. This blog will also discuss how to connect Microsoft Excel database from Tableau.
Download Tableau
Tableau desktop trial version is available for two weeks. Tableau public is available for free.
Download Tableau Public or trial version of Tableau desktop.
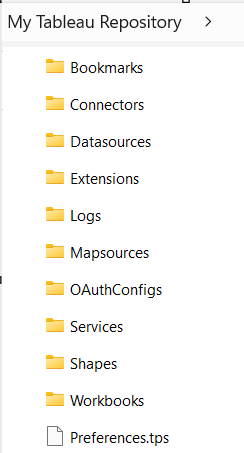
When Tableau Public or Desktop is installed, Tableau automatically creates a My Tableau Repository folder in your machine’s documents folder – \Documents\My Tableau Repository. This folder contains Tableau related files.
2. Launch Tableau Public or Tableau desktop. This example uses Tableau Public.
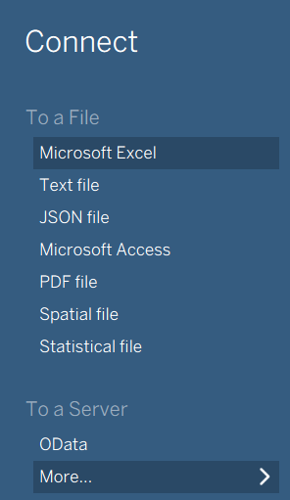
3. Connect option shows all data sources available for connection to fetch data. Tableau can connect to wide variety of data sources. For this example, select Microsoft Excel.
You will be navigated to My Tableau Repository folder where you can connect to Tableau provided Sample-SuperStore.xls. If you want to use some other file, you can also browse and connect to any excel data source of your choice.
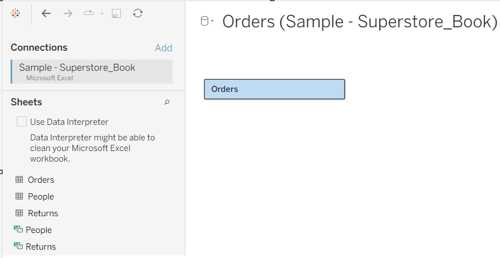
4. Once you are connected to Sample-SuperStore.xls, you will see the 3 Excel Worksheets on the left. These Worksheets work just like database tables. You can create joins between the sheets or create relationships.
Drag Orders in the Drag Tables here to create a data model space.
5. Preview of data will be displayed. Data preview window shows only 1000 records. You can modify/rename your fields here, if you require to do so.
From the bottom of the screen, click on Sheet1. You will be navigated to Tableau workspace.
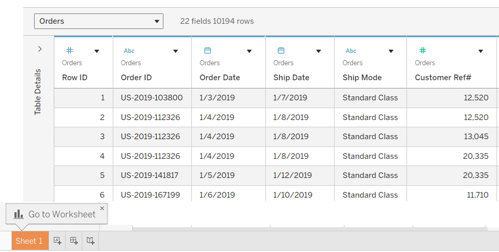
Tableau Workspace
6. Observe the data pane on the left, Tableau automatically segregates the data into Dimensions and Measures.
7. From Dimensions, place Sub-Category on Columns. From Measures, place Sales on Rows. Place Region on Color.
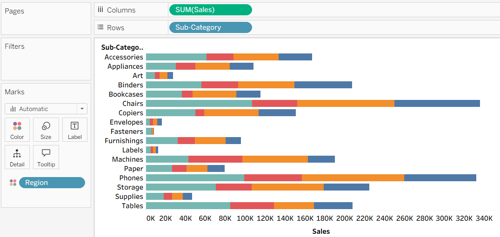
Tips:
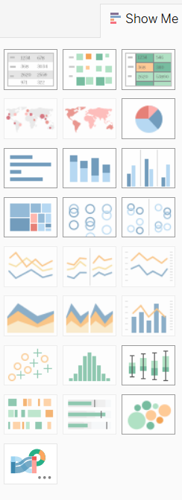
If you don’t get a bar chart automatically, select one from Show Me from the right.
2. You can sort the chart using the icons on the tool bar.
Tableau Relationships are a new way of combining multiple data from multiple tables. Learn more at Relationships in Tableau
For more blogs on Tableau, visit http://www.learntableaupublic.com/

Chandraish Sinha is the Founder and President of Ohio Computer Academy, a leading institution committed to delivering high-quality IT education. With a passion for teaching and a belief in his company’s mission—Inspire, Educate & Evolve—Chandraish brings over 25 years of experience in the Information Technology industry.
Explore more of his work on his Amazon Author Profile.


Post a Comment