
In Tableau dashboards, when data is not produced for the selected filters, it displays a blank page. Tableau does not have any default functionality to display a custom message when there is no data. In this blog, we will discuss how to display a custom message ‘No data found’ in Tableau.
Create a dashboard in Tableau
To explain this concept, I will create a visualization and a dashboard in Tableau.
1. Connect to Sample – Superstore.xls and navigate to Sheet1. If you are new to Tableau, learn how to connect to MS-Excel datasource.
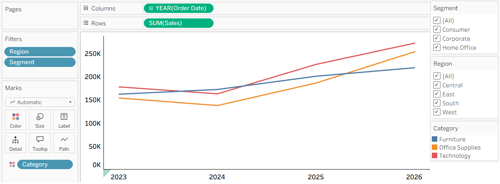
2. From the Data pane on the left, place Order Date on Columns and Sales on Rows. Place Category on Colors to get distinct colors for each Category.
This will create a Line/Trend chart for Sales by Category over various Years. Name this Sheet “Sales Trend by Category”.
3. From the Data pane, select Region and Segment as your filters. Right-click on each and select Show filter. These fields will be displayed as filters on your visualization.
4. To create a new dashboard, from the bottom of your screen, click on the Dashboard icon or from the menu, select Dashboard/New Dashboard.
On the left pane, from the Sheets list , drag Sales Trend by Category onto the dashboard canvas
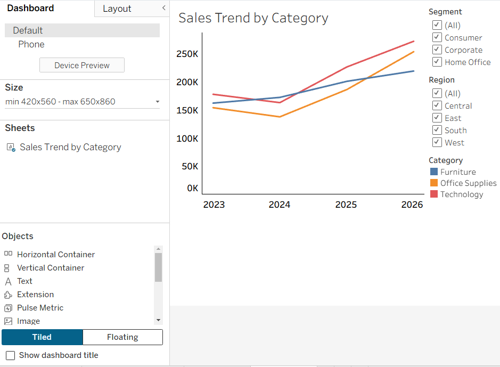
Tableau dashboard containing the Sales Trend by Category chart
Tip: To make room while arranging the chart and message, open the menu on each Region and Segment filter card and select Remove from Dashboard. You can show these filter cards again after positioning the objects..
How to display No Data Found Text
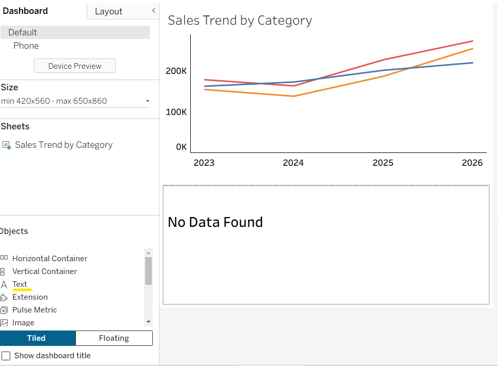
1. In the Objects pane on the left, select Tiled, then drag a Text object onto the dashboard below the chart. In the Edit Text dialog box, enter “No Data Found” and click OK.
The chart and text object should now appear in separate tiled areas, as shown below.
2. Select the trend chart, open its drop-down menu, and choose Floating. Resize and position the chart on the dashboard.
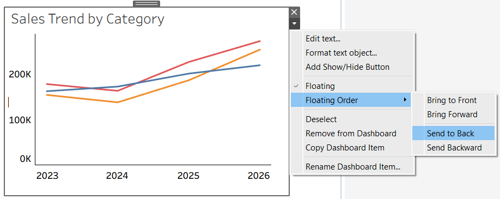
Next, select the “No Data Found” text object and make it Floating. Position it within the chart’s display area, where you want the message to appear.
From the text object’s menu, choose Floating Order > Send to Back, so the text sits behind the chart.
3. If you removed the filter cards earlier, select the chart, open its drop-down menu, and choose Filters > Region and Filters > Segment to display them again. The filter cards may also be floating, so you may need to reposition and resize them on the dashboard.
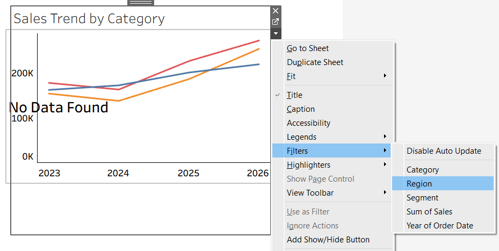
Adding filters for Region and Segment by selecting the chart.
When the selected filters return data, the chart should appear and hide the “No Data Found” message. When no data matches the selected filters, the message should become visible.
4. To test, in the Region filter, clear the (All) checkbox to deselect every region. The chart should become blank, revealing the “No Data Found” message behind it. Select (All) again to restore the chart and confirm that the message is hidden.
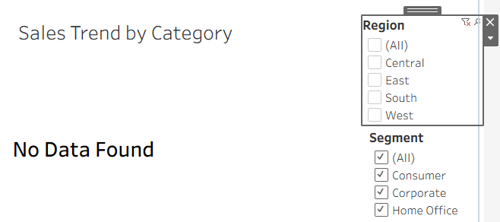
“No Data Found” appears when all regions are deselected.
Learn how to reset all the filters in Tableau.
Build Better Tableau Dashboards
Want to create interactive dashboards that are clear and easy to use? Develop your skills with Ohio Computer Academy’s instructor-led Tableau training, available online and in person in Dublin, Ohio.

Chandraish Sinha is the Founder and President of Ohio Computer Academy, a leading institution committed to delivering high-quality IT education. With a passion for teaching and a belief in his company’s mission—Inspire, Educate & Evolve—Chandraish brings over 25 years of experience in the Information Technology industry.
Explore more of his work on his Amazon Author Profile.


Post a Comment