
Aggregations or Totals are important in any Visualization application. In Tableau, it is easy to display totals in your charts. There are many variations to creating Totals and Subtotals. In this article, we will discuss how to create Totals in Tableau.
Adding Grand Totals and subtotals in Tableau
In Tableau, Totals can be displayed by using the options available in the Analysis menu. We can display Grand Totals in Rows and columns. Subtotals can also be displayed for various dimensions.
To explain this concept, I will connect to Tableau provided Sample-Superstore.xls. If you are new to Tableau, learn how to connect to excel datasource and create a chart.
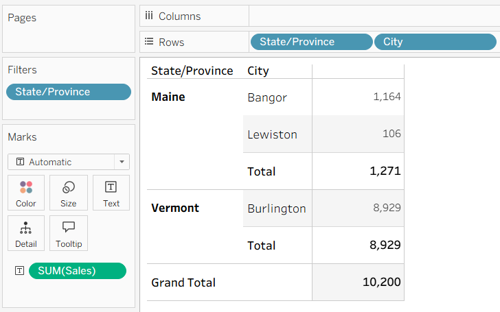
Create a Table visual by using dimensions – State and City on the Rows and a measure – Sales on the Text (under Marks). For display purposes, I will filter the data for the States – Maine and Vermont, as these states have less number of Cities.
To add Sub-totals for each State, navigate to Analysis >Totals > Add All Subtotals.
Next, to display the overall grand total for all states, navigate to Analysis > Totals > Show Column Grand Totals.
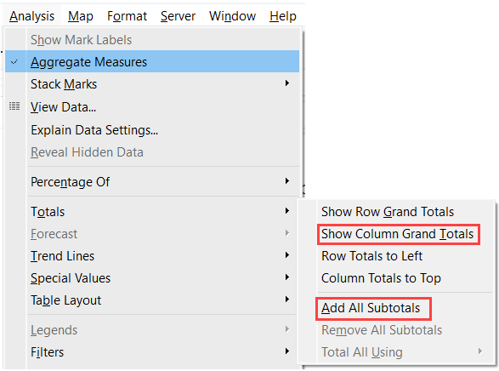
The resulting table displays subtotals for each state and a grand total at the bottom, representing the total sales across all selected states.
Creating Subtotals for different dimension levels
In the existing table, drag Category, Sub-Category, and Segment to the Rows shelf, placing them after City. The table now contains multiple dimension levels: State, City, Category, Sub-Category, and Segment.
To display subtotals at the applicable dimension levels, navigate to Analysis > Totals > Add All Subtotals. Tableau will calculate subtotals for the nested dimensions. The Grand Total enabled in the previous section will remain visible.
Notice that Tableau displays the word Total in the subtotal labels at different levels, which can make the table difficult to read. To customize these labels, right-click a subtotal label and select Format. In the formatting pane, locate the Totals label setting and change the displayed text as needed.
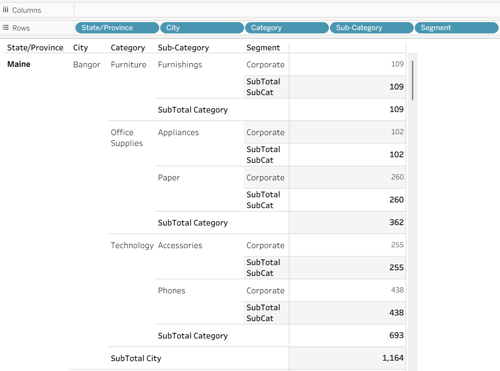
Sample rows after adding the Subtotals at different levels and changing the Subtotal label
Removing the Subtotals from a dimension level
In some cases, you may want to remove the Subtotals from a specific dimension.
We can always navigate to the Analysis menu and from the Totals select Remove All Subtotals. But this will remove all of the Subtotals from the table. If you want to remove subtotals at a certain level, say for e.g. from the Sub-Category level, then this solution will not work.
To remove a subtotal at a specific dimension level, on the Rows, right-click on that specific dimension and uncheck subtotals.
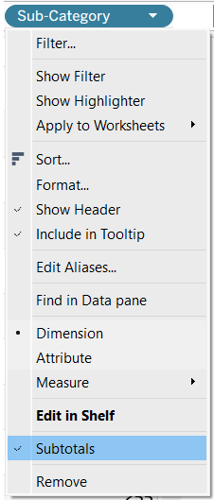
Note: Tableau allows you to enable or disable subtotals for individual dimension levels. However, the Subtotal option is not available for the innermost dimension on the Rows shelf because there is no additional dimension nested beneath it to summarize.
For example, when the dimensions are arranged as State, City, Category, Sub-Category, and Segment, you can control subtotals for the outer dimensions, but not for Segment.
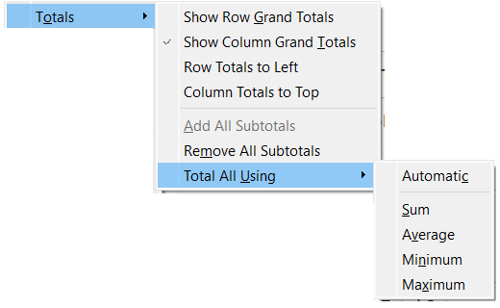
When Totals are used in the above fashion, Tableau is calculating them automatically. If you wish to control it or want to calculate it in a different way, then navigate to Analysis menu and from the Totals select Total All Using.
Changing How Totals Are Calculated in Tableau
By default, Tableau calculates grand totals and subtotals automatically based on the measures and aggregations used in the visualization.
If you want to change how the totals are calculated, navigate to Analysis > Totals > Total All Using. You can select from the available options, such as Automatic, Sum, Average, Minimum, or Maximum.
For example, selecting Average calculates the totals using the average instead of the default aggregation.
If you follow the above mentioned steps you can create effective Totals and Sub-totals based on visualization requirements.
Learn More About Tableau
Want to develop your Tableau skills beyond creating totals and subtotals?
At Ohio Computer Academy, we offer hands-on, instructor-led Tableau training covering data visualization, calculations, filters, parameters, and interactive dashboards. Training is available live online or in person in Dublin, Ohio.
Explore Our Tableau Training Courses
For additional examples and practical learning, explore my book Dashboarding with Tableau.

Chandraish Sinha is the Founder and President of Ohio Computer Academy, a leading institution committed to delivering high-quality IT education. With a passion for teaching and a belief in his company’s mission—Inspire, Educate & Evolve—Chandraish brings over 25 years of experience in the Information Technology industry.
Explore more of his work on his Amazon Author Profile.


Post a Comment