
Relationships in Tableau provide a flexible way to combine data from multiple tables within a data source while keeping the tables separate. Relationships differ from joins and data blending. In this tutorial, you will learn how to create a relationship between two tables using a common field.
Tableau introduced relationships between tables in version 2020.2. Prior to this version, it used joins to display data from two or more tables.
If you are new to Tableau, learn how to connect to excel datasource in Tableau
How Tableau defines a Relationship?
Relationships are a new default to combine data from multiple tables from different sources.
When tables from different data sources are placed on data canvas, Tableau automatically creates a relationship between them.
A relationship is created based on the common field names between the tables.
The relationship works in the same way as database relationships.
Based on the data in tables, Tableau also assigns the cardinality (Performance Options) by default. If desired, you can change the columns on which the relationship is created and/or the cardinality.
Once the relationship is established, Tableau will automatically identify the join type when fields are used in the view.
Data blending is available as before.
A relationship in Tableau is shown below:
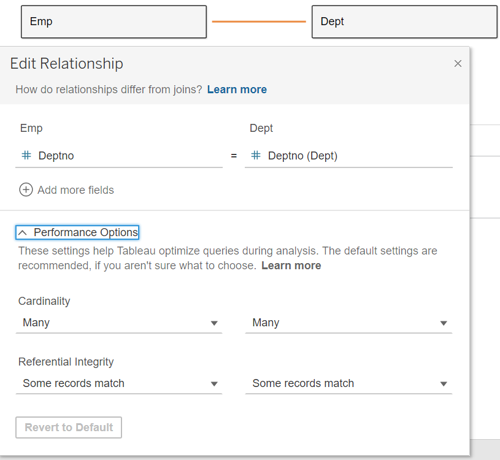
In the above figure, the relationship between Emp and Dept is created based on the common field Deptno.
Relationship between tables is NOT a join. A Join between two tables merges the tables and creates one table but a relationship keeps the tables separate.
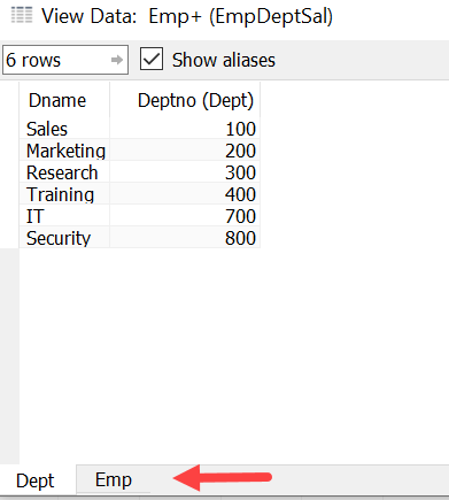
When you click on the individual table in a relationship, data pertaining to only that table is displayed in the data preview.
Understanding the Data Pane with Relationships
After creating the relationship, click on Sheet1 to open a worksheet. With fields grouped by data source table, the Data pane displays the fields under Dept and Emp, as shown below.
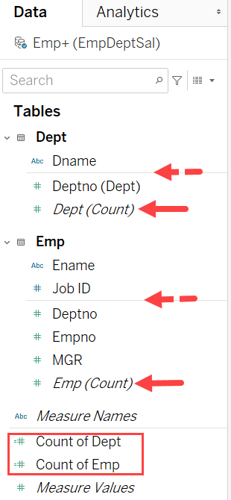
The following changes can be observed:
Fields are grouped by table. When the Data pane is grouped by data source table, dimensions and measures appear under their respective tables, separated by a gray line.
Each table has its own count field. Tableau provides Dept (Count) and Emp (Count) to count records in the respective tables, replacing the single Number of Records field used in older versions.
Calculations using fields from one table generally appear under that table.
Calculations using fields from multiple tables generally appear in the shared area below the table groups.
You can inspect each table separately. Open View Data from the Data pane to explore the records in the related tables.
Creating relationships is an intuitive way to combine data from multiple tables. When using relationship option, you don’t have to know what joins to use but focus more on how tables are related.
Tableau provides various methods for combining data, including relationships, Joins, Unions, and Data Blending. Learn which method to use in specific scenarios.
Build Your Tableau Skills
Want to learn how to connect data, create visualizations, and build interactive dashboards? Join Ohio Computer Academy’s instructor-led Tableau training, available online and in person in Dublin, Ohio.

Chandraish Sinha is the Founder and President of Ohio Computer Academy, a leading institution committed to delivering high-quality IT education. With a passion for teaching and a belief in his company’s mission—Inspire, Educate & Evolve—Chandraish brings over 25 years of experience in the Information Technology industry.
Explore more of his work on his Amazon Author Profile.
0 Comments
0 Comments


Post a Comment