
Ohio Computer Academy - IT Training & Vocational Education in Dublin, OH
All Courses
  • Free Training Courses
  • AI for Your Role
  • AI & Machine Learning
  • Cloud Tech
  • Data Science
  • DevOps
  • Dashboarding/BI
  • Database
  • WebDevelopment
  • Programming & Coding
  • MS Office & Workplace Productivity
  • QA & Test Automation
  • Professional & Career Development
  • Cyber Security

Courses

  • Computer Fundamentals for Beginners
  • MS Word for Beginners
  • Microsoft Excel for Beginners
  • Microsoft Azure for Beginners
  • AWS Cloud for Beginners
  • Oracle SQL Fundamentals
  • Tableau Fundamentals
  • Power BI Fundamentals
Explore All Programs

Courses

  • AI Essentials
  • AI for Administrative Professionals New Launch
  • AI for Managers & Team Leads
  • AI for Data Analytics & Power BI
  • AI for Software Developers
  • AI for Database & SQL Professionals
  • AI for Project Managers
  • AI for Marketing Professionals
  • AI for Sales Professionals
  • AI for HR Professionals
  • AI for Finance Professionals
  • AI for Customer Support Professionals
  • AI for QA & Test Engineers
  • AI for IT Support & System Admins
  • AI for Cybersecurity Analysts
  • AI for Job Seekers
Explore All Programs

Courses

  • Learn Claude Basics New Launch
  • Learn Claude Advanced New Launch
  • Applied Artificial Intelligence (AI) New Launch
  • AI for Workplace Productivity
  • Azure Fundamentals with AI
  • Advanced Microsoft Azure with AI
  • AI Implications for Business Strategy
  • Mastering ChatGPT & Generative AI Tools
  • Prompt Engineering
  • Agentic AI Solutions
  • AI Product Management
  • AI for Quality Control
Explore All Programs

Courses

  • AZ-900 Azure Fundamentals
  • DP-900 Azure Data Fundamentals
  • DP-100 Data Science on Azure
  • AWS Essentials
  • AWS Cloud Practitioner
  • AWS Solutions Architect
Explore All Programs

Courses

  • DP-100 Data Science on Azure
Explore All Programs

Courses

  • DevOps Essentials
  • DevOps with AWS
  • DevOps with Azure
Explore All Programs

Courses

  • Business Analytics: From Data to Insights New Launch
  • Power BI Advanced
  • Data Analytics with Excel
  • Tableau Beginner
  • Tableau Data Consumer
  • Alteryx & Tableau
  • Tableau Advanced
  • Tableau Certification prep
  • Power BI Beginner
  • Cognos Analytics
Explore All Programs

Courses

  • SQL Server for Beginners
  • SQL for Analysts
  • SQL Server Advanced
  • SQL Server T-SQL Programming
  • SSIS
  • Oracle SQL for Beginners
  • Oracle PL/SQL
  • Oracle SQL Advanced
  • Big Data with Hadoop: HDFS, MapReduce & Ecosystem Tools
  • MS Access
Explore All Programs

Courses

  • Angular Frontend Development
  • Spring 5 Framework
  • Full Stack Web Development
Explore All Programs

Courses

  • Learn Python
  • Python PCEP
  • Python PCAP
  • JavaScript & jQuery
  • Java Certification
  • Python for Data Science
  • Machine Learning with Python
Explore All Programs

Courses

  • Analyzing Data with Excel New Launch
  • Workplace Digital Skills
  • Excel Beginners to Advanced Trending Now
  • Excel for Finance
  • Excel for HR
  • Workplace Computer Skills
Explore All Programs

Courses

  • Selenium QA Automation (Java)
  • Selenium QA Automation (Python)
  • API Testing
  • QA Automation with Python (Advanced)
Explore All Programs

Courses

  • Scrum Master Certification
  • Lean Six Sigma Green Belt Certification
  • Business Analyst
Explore All Programs

Courses

  • Cyber Security Foundations for Beginners
  • Computer Networking for Cybersecurity
  • Windows & Linux Security Administration
  • Ethical Hacking & Penetration Testing
  • Artificial Intelligence (AI) in Cybersecurity
Explore All Programs
  • About Us
    • OCA Skill Sprint Method
    • Meet the Founder
  • Blogs
    • Career Building
    • AI / Machine Learning
    • MS Excel
    • Programming Essentials
    • Database
    • Cloud Computing
    • Tableau
    • Power BI
    • Web Development
    • Tips for Success
    • Qlik
    • Soft Skills
    • Technology
    • Business Intelligence Analyst
    • Message from the CEO
    • DATA ANALYST
  • TechCred
  • Find Your Training
  • Contact Us
Ohio Computer Academy - IT Training & Vocational Education in Dublin, OH


  • info@ohiocomputeracademy.com
  • +1 866-648-7284
  • Home
  • About Us
  • Blogs
    • Career Building
    • AI / Machine Learning
    • MS Excel
    • Programming Essentials
    • Database
    • Cloud Computing
    • Tableau
    • Power BI
    • Web Development
    • Tips for Success
    • Qlik
    • Soft Skills
    • Technology
    • Business Intelligence Analyst
    • Message from the CEO
    • DATA ANALYST
  • TechCred
  • Find Your Training
  • Contact Us
Find With Us
  • Home
  • Blogs
  • Power BI
  • Cardinality in Power BI: One-to-Many and Other Examples

Cardinality in Power BI: One-to-Many and Other Examples

Cardinality in Power BI: One-to-Many and Other Examples

Cardinality in Power BI defines how data in one table relates to data in another. When building relationships between tables like Orders, OrderDetails, and Customers, it’s essential to choose the correct cardinality to ensure accurate results in reports and dashboards.

In this blog, we’ll explain what cardinality means, the types of cardinality available in Power BI, and how to apply them correctly using practical examples from a typical sales dataset.

New to Power BI? Get hands-on, step-by-step guidance in our Power BI for Beginners course. Start learning now.

What Is Cardinality in Power BI?

Cardinality refers to the number of elements in one table that relate to the number of elements in another table. When you create a relationship between two tables in Power BI, you must define the cardinality so Power BI knows how to join them.

There are three main types of cardinality in Power BI:

  • One-to-many (1:*): One row in Table A relates to many rows in Table B.

  • Many-to-one (*:1): Many rows in Table A relate to one row in Table B (functionally the same as 1:* depending on direction).

  • Many-to-many (:): Many rows in Table A relate to many rows in Table B.

We will explore these cardinalities using the same example tables from our previous post, How to create relationships in Power BI

Table structure used to explain Cardinality in Power BI between Orders, OrderDetails, and Customers

Example 1: One-to-Many Cardinality in Power BI: Customers to Orders

Let’s start with the most common type of relationship.

  • Table A: Customers

  • Table B: Orders

  • Relationship: One customer can place many orders

In Power BI:

  • Connect the CustomerID column in Customers to CustomerID in Orders.

  • The relationship is One-to-Many (1:*), with Customers on the “one” side and Orders on the “many” side.

This is ideal cardinality when you want to create a report that shows the total orders per customer or analyze customer segments.

Example 2: One-to-Many: Orders to OrderDetails

  • Table A: Orders

  • Table B: OrderDetails

  • Relationship: One order contains multiple products/items

In Power BI:

  • Connect OrderID from Orders to OrderID in OrderDetails.

  • Again, this is a One-to-Many (1:*) relationship.

This setup lets you:

  • Analyze sales per order using the details from OrderDetails.

  • Drill down from a high-level order view to individual product-level details.

Example 3: Many-to-One: Orders to Customers

In Power BI, the term Many-to-One is often used when the relationship is viewed from the perspective of the fact table. For example:

  • Table A: Orders (fact table)

  • Table B: Customers (dimension/lookup table)

  • Relationship: Many orders belong to one customer

Although this is essentially the same as a One-to-Many (1:*) relationship, Power BI may display it as Many-to-One (*:1) depending on how the tables are selected during relationship creation.

In Power BI:

  • CustomerID in Orders is connected to CustomerID in Customers.

  • Power BI represents this as a (*:1) relationship — many rows in Orders relate to one row in Customers

Why this matters:
Understanding this distinction is useful when filtering visuals or writing DAX expressions, especially in complex models. It helps clarify filter direction, lookup behavior, and relationship context.

Table A

Table B

Relationship

Direction

Customers

Orders

One-to-Many (1:*)

One customer, many orders

Orders

Customers

Many-to-One (*:1)

Many orders, one customer

In practice, these are functionally the same — Power BI handles them identically, but understanding the terminology helps when reading documentation or troubleshooting relationships. When creating a relationship, always select Customers as the first table (table with unique) values and select Orders as the second table.

Many-to-Many Relationships: A Special Case

While most relationships in Power BI follow a one-to-many pattern, certain scenarios may require a many-to-many relationship. This happens when both tables contain duplicate values for the join column, and neither side has a unique key.

Let’s consider the Orders and OrderDetails tables:

  • Normally, OrderID in Orders is unique, and OrderID in OrderDetails contains multiple entries.

  • But imagine a scenario where Orders is not properly cleaned, and it contains duplicate OrderID values (perhaps due to an accidental import of duplicate rows).

  • Now both Orders and OrderDetails contain multiple rows with the same OrderID, with no unique side to anchor a one-to-many relationship.

In this case, Power BI allows you to create a many-to-many (:) relationship, but it’s generally recommended to resolve the data quality issue instead.

Cross Filter Direction & Cardinality

When defining relationships, you’ll also choose cross filter direction:

  • Single: Filters flow in one direction (default for 1:*)

  • Both: Allows filters to flow in both directions (required for many-to-many)

Stick with single direction unless you have a specific reason and know the data model well.

Best Practices for Choosing Cardinality

  • Always start with One-to-Many: Most normalized data models follow this.

  • Use Lookup Tables on the “one” side: Customers, Products, etc.

  • Avoid Many-to-Many unless absolutely required.

  • Validate Data: Use “Manage Relationships” > “View” mode to check arrows and filter direction.

Understanding cardinality in Power BI is crucial to building efficient and accurate data models. Whether you’re working with Customers, Orders, or OrderDetails, choosing the right cardinality ensures your visualizations reflect the true story of your data.

Expand Your Power BI Skills

Interested in mastering Power BI beyond the basics?
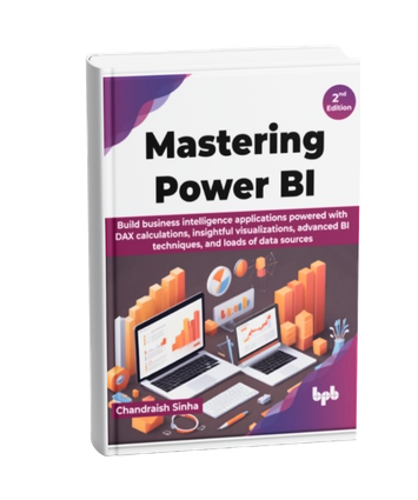
Mastering Power BI.png

Explore the comprehensive guide Mastering Power BI, Second Edition — packed with advanced data modeling, DAX techniques, and real-world reporting strategies.

If you’re looking for hands-on, instructor-led Power BI training, contact us today to learn more about upcoming courses and private training options.

Like
Chandraish Sinha

Chandraish Sinha is the Founder and President of Ohio Computer Academy, a leading institution committed to delivering high-quality IT education. With a passion for teaching and a belief in his company’s mission—Inspire, Educate & Evolve—Chandraish brings over 25 years of experience in the Information Technology industry.

Explore more of his work on his Amazon Author Profile.

0 Comments

Add Your Comment

Post a Comment

Required fields are marked *

✅ Thanks for adding your comment! It will appear after moderation.

0 Comments

Related Blogs
View All Blogs
Power BI Components
Read More
Connect to Excel Data Source in Power BI
Read More
Creating Scatter Chart in Power BI
Read More
Ohio Computer Academy - IT Training & Vocational Education in Dublin, OH

Registered with the Ohio State Board of Career Colleges and Schools — School Registration No. 2395

About Us
  • Contact Us
  • Our Story
  • Training Gallery
  • Reviews
  • Books
  • Greater Columbus Training Center
Trainings/Services
  • Course Categories
  • Learning Paths
  • Frequently Asked Questions
  • AI Advantage
Contact Us
  • Phone:+1 866-648-7284
  • E-mail: info@ohiocomputeracademy.com
  • Address:

    Dublin, Ohio
    5900 Sawmill Road, Suite # 150, Dublin, OHIO 43017 USA

Thank you
Failed
Free Training Courses
  • Computer Fundamentals for Beginners
  • MS Word for Beginners
  • Microsoft Excel for Beginners
AI Courses
  • Claude Basics
  • Claude Advanced
  • AI for Workplace Productivity
  • Prompt Engineering
  • Agentic AI Solutions
  • AI for Quality Control
Cloud Tech
  • DP-900 Azure Data Fundamentals
  • DP-100 Data Science on Azure
  • AWS Technical Essentials
  • AWS Cloud Practitioner
  • AWS Solutions Architect
DevOps
  • DevOps Essentials
  • DevOps with AWS
  • DevOps with Azure
Dashboarding/BI
  • Tableau Beginner
  • Power BI Beginner
  • Data Analytics with Excel
Database
  • Oracle SQL for Beginners
  • SQL for Analysts
  • SQL Server for Beginners
MS Office & Workplace Productivity
  • Workplace Digital Skills
  • Excel for Finance
  • Excel for HR
  • Excel Beginners to Advanced
  • Workplace Computer Skills
Learning Hub
  • Begin Your IT Career
  • Generative AI & Workplace Productivity Foundations
  • Claude AI Learning Path
  • Data Visualization Foundations
  • Data Analytics Career Path
  • AI for Business & Data Applications
  • Programming Foundations & Development Path

© 2026 Ohio Computer Academy. All rights reserved.

  • Privacy
  • Terms & Conditions