
Ohio Computer Academy - IT Training & Vocational Education in Dublin, OH
All Courses
  • Free Training Courses
  • AI for Your Role
  • AI & Machine Learning
  • Cloud Tech
  • Data Science
  • DevOps
  • Dashboarding/BI
  • Database
  • WebDevelopment
  • Programming & Coding
  • MS Office & Workplace Productivity
  • QA & Test Automation
  • Professional & Career Development
  • Cyber Security

Courses

  • Computer Fundamentals for Beginners
  • MS Word for Beginners
  • Microsoft Excel for Beginners
  • Microsoft Azure for Beginners
  • AWS Cloud for Beginners
  • Oracle SQL Fundamentals
  • Tableau Fundamentals
  • Power BI Fundamentals
Explore All Programs

Courses

  • AI Essentials
  • AI for Administrative Professionals New Launch
  • AI for Managers & Team Leads
  • AI for Data Analytics & Power BI
  • AI for Software Developers
  • AI for Database & SQL Professionals
  • AI for Project Managers
  • AI for Marketing Professionals
  • AI for Sales Professionals
  • AI for HR Professionals
  • AI for Finance Professionals
  • AI for Customer Support Professionals
  • AI for QA & Test Engineers
  • AI for IT Support & System Admins
  • AI for Cybersecurity Analysts
  • AI for Job Seekers
Explore All Programs

Courses

  • Learn Claude Basics New Launch
  • Learn Claude Advanced New Launch
  • Applied Artificial Intelligence (AI) New Launch
  • AI for Workplace Productivity
  • Azure Fundamentals with AI
  • Advanced Microsoft Azure with AI
  • AI Implications for Business Strategy
  • Mastering ChatGPT & Generative AI Tools
  • Prompt Engineering
  • Agentic AI Solutions
  • AI Product Management
  • AI for Quality Control
Explore All Programs

Courses

  • AZ-900 Azure Fundamentals
  • DP-900 Azure Data Fundamentals
  • DP-100 Data Science on Azure
  • AWS Essentials
  • AWS Cloud Practitioner
  • AWS Solutions Architect
Explore All Programs

Courses

  • DP-100 Data Science on Azure
Explore All Programs

Courses

  • DevOps Essentials
  • DevOps with AWS
  • DevOps with Azure
Explore All Programs

Courses

  • Business Analytics: From Data to Insights New Launch
  • Power BI Advanced
  • Data Analytics with Excel
  • Tableau Beginner
  • Tableau Data Consumer
  • Alteryx & Tableau
  • Tableau Advanced
  • Tableau Certification prep
  • Power BI Beginner
  • Cognos Analytics
Explore All Programs

Courses

  • SQL Server for Beginners
  • SQL for Analysts
  • SQL Server Advanced
  • SQL Server T-SQL Programming
  • SSIS
  • Oracle SQL for Beginners
  • Oracle PL/SQL
  • Oracle SQL Advanced
  • Big Data with Hadoop: HDFS, MapReduce & Ecosystem Tools
  • MS Access
Explore All Programs

Courses

  • Angular Frontend Development
  • Spring 5 Framework
  • Full Stack Web Development
Explore All Programs

Courses

  • Learn Python
  • Python PCEP
  • Python PCAP
  • JavaScript & jQuery
  • Java Certification
  • Python for Data Science
  • Machine Learning with Python
Explore All Programs

Courses

  • Analyzing Data with Excel New Launch
  • Workplace Digital Skills
  • Excel Beginners to Advanced Trending Now
  • Excel for Finance
  • Excel for HR
  • Workplace Computer Skills
Explore All Programs

Courses

  • Selenium QA Automation (Java)
  • Selenium QA Automation (Python)
  • API Testing
  • QA Automation with Python (Advanced)
Explore All Programs

Courses

  • Scrum Master Certification
  • Lean Six Sigma Green Belt Certification
  • Business Analyst
Explore All Programs

Courses

  • Cyber Security Foundations for Beginners
  • Computer Networking for Cybersecurity
  • Windows & Linux Security Administration
  • Ethical Hacking & Penetration Testing
  • Artificial Intelligence (AI) in Cybersecurity
Explore All Programs
  • About Us
    • OCA Skill Sprint Method
    • Meet the Founder
  • Blogs
    • Career Building
    • AI / Machine Learning
    • MS Excel
    • Programming Essentials
    • Database
    • Cloud Computing
    • Tableau
    • Power BI
    • Web Development
    • Tips for Success
    • Qlik
    • Soft Skills
    • Technology
    • Business Intelligence Analyst
    • Message from the CEO
    • DATA ANALYST
  • TechCred
  • Find Your Training
  • Contact Us
Ohio Computer Academy - IT Training & Vocational Education in Dublin, OH


  • info@ohiocomputeracademy.com
  • +1 866-648-7284
  • Home
  • About Us
  • Blogs
    • Career Building
    • AI / Machine Learning
    • MS Excel
    • Programming Essentials
    • Database
    • Cloud Computing
    • Tableau
    • Power BI
    • Web Development
    • Tips for Success
    • Qlik
    • Soft Skills
    • Technology
    • Business Intelligence Analyst
    • Message from the CEO
    • DATA ANALYST
  • TechCred
  • Find Your Training
  • Contact Us
Find With Us
  • Home
  • Blogs
  • Power BI
  • How to Validate Data in Power BI with Column Quality

How to Validate Data in Power BI with Column Quality

Validating data is one of the most important steps before building reports in Power BI. Without clean, reliable data, even the most polished dashboards can give misleading insights. One simple yet powerful way to validate data in Power BI is by using Column Quality in Power Query.

In an earlier blog, we explored how to validate data using Group By in Power BI. In this post, we’ll focus on another method: validating data with Column Quality.

This built-in profiling feature allows quick checks for errors, empty values, and unusual patterns, ensuring data quality before it ever reaches the model.

The Column Quality option is available in Power Query ribbon under the View tab. The View tab also contains other useful options.
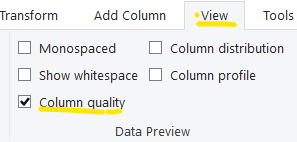
                             The Column Quality option in Power Query Editor can be enabled from the View tab

Why Validate Data in Power BI?

When working with business data, common issues include:

  • Missing or blank values

  • Duplicate or inconsistent entries

  • Outliers in numeric fields

  • Incorrect data types

Catching these issues early prevents inaccurate totals, broken relationships, and incorrect KPIs later in the report.

What is Column Quality in Power Query?

Column Quality is a profiling feature that provides an at-a-glance summary of each column in Power Query. It shows:

  • Valid values: data that is correctly formatted

  • Errors: values that don’t match the expected type

  • Empty: blank or null values

This helps to immediately identify whether a column is clean or needs transformation.

Sample Dataset Used in this Power BI Validation Demonstration

To demonstrate an hands-on exercise to explain data validation using Column quality. I will be using the following table:

Sample dataset used to validate data in Power BI with Column QualitySample dataset used in this demonstration to validate data in Power BI with Column Quality.

Note about the data set:

This dataset contains around 3,000 rows, but only a portion is shown here for demonstration purposes. If you would like the full dataset for practice, feel free to mention it in the comments.

To demonstrate how to validate data, some errors have been intentionally included in this sample:

  • Customer Name: certain names (e.g., Dareen Powers) contain leading spaces.

  • Order Date: some cells contain text values such as “T”, “Q”, or “R” instead of valid dates.

  • Customer ID: includes text entries such as “L”, “M”, and “T” instead of numeric IDs.

Hands-On Demonstration: Validate Data with Column Quality

  1. Load the Sample dataset using Query Editor.

  2. Navigate to Query Editor ribbon and then View tab. Check the options for Show whitespace.
    Checking “Show whitespace” show that Customer Name “Dareen Powers” contains some leading spaces and also Segment “Home Office” is displayed with the new line. These formatting issues in the data can be corrected if needed.

Power Query Show Whitespace option highlighting leading spaces in Customer Name and line breaks in Segment column for data validation in Power BIEnabling Show Whitespace in Power Query reveals hidden issues such as leading spaces and line breaks in the Segment column.
  1. Validating Column quality. Under the View tab, select the Column quality option. This will display a small section below the column headers, displaying if the values in the column are Valid, Error or Empty as shown in the figure below:

Column Quality in Power Query showing data validation indicators for Valid, Error, and Empty values in Power BI datasetWhen Column Quality is enabled, each column displays indicators for valid, error, and empty values to help validate data in Power BI.

In the current rows of data, all columns display 100% valid with no errors. However, remember that by default, Power Query profiles only the first 1,000 rows of data. To ensure accuracy, it’s best to profile the entire dataset to check for potential issues.

To include the entire dataset in profiling, navigate to the bottom of the Query Editor (below the data preview) and select Column profiling based on entire dataset, as shown in the following figure:

Power Query option to switch column profiling from top 1000 rows to entire dataset in Power BISelect Column profiling based on entire dataset to check data quality across all rows.

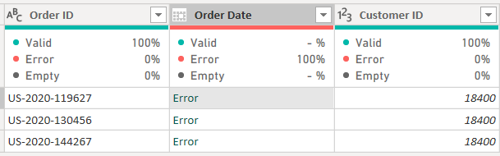
After selecting “Column profiling based on entire dataset”, the Column Quality bar will highlight errors in some columns, such as Order Date and Customer Ref#. When hovering over these columns, Power Query displays a summary of the issue along with a suggested fix, such as Remove errors as shown in the figure below:

Power Query Column Quality showing errors in Order Date column with suggestion to Remove Errors in Power BI
Column Quality highlights errors in the Order Date column, and hovering over the column provides details with a suggested fix such as Remove Errors.

The developer should decide to take Query Editor suggestions and remove the errors or explore more to understand the cause of the error.

Understanding the Errors Reported by Column Quality

It is crucial to understand the errors identified by Column Quality before attempting to remove them. This ensures that valid data is not accidentally discarded.

  1. Select the Order Date column as Column quality reported error on it. Right-click on the Column quality bar and select “Keep errors”, as shown in the following figure:

Power Query Column Quality options menu showing actions such as Keep Errors, Remove Duplicates, Remove Empty, Remove Errors, and Replace Errors in Power BI
             Column Quality menu provides options to manage data issues.

Observe that the view changes to show the errors in the Order Date column.

Notice a new step “Kept Errors” is added to the Applied Steps

  1. Click on the first error (in the data preview window) to see the details. It displays the error as shown in the following figure:

Details of the error when the “error” is clicked in the data preview of Order Date

The error shows that a non-date data type value (T) is present in the Order Date column and query editor is unable to parse it.

Tip: To return to the entire error list, cross/delete the step “Order Date” under Applied steps.

When checking other errors, similar details appear, indicating that a few non-date values are present in the Order Date column. For the purposes of this example, these rows are not required, so we can accept Power Query’s suggestion to remove the errors.

  1. Delete the step “Kept Errors” from the Applied Steps and return to the entire data preview.

  2. Select the Order Date column, mouse hover on the Column quality bar and from the error summary, select “Remove Errors”. Notice how Applied Steps show “Removed Errors” step.
    This will remove errored rows and display Column quality on Order Date as Valid 100%.

  3. Similarly, we can explore the errors in Customer ID column or accept the Query editor suggestion of removing the error.

Column Quality is just one way to ensure clean data. Another simple approach is to validate data with Group By in Power BI, which helps confirm totals and detect issues across different dimensions.

Have questions or want the full sample dataset to practice with? Drop a comment below — I’d be happy to share it with you.

New to Power BI? Get hands-on, step-by-step guidance in our Power BI for Beginners course. Start learning now.



Like
Chandraish Sinha

Chandraish Sinha is the Founder and President of Ohio Computer Academy, a leading institution committed to delivering high-quality IT education. With a passion for teaching and a belief in his company’s mission—Inspire, Educate & Evolve—Chandraish brings over 25 years of experience in the Information Technology industry.

Explore more of his work on his Amazon Author Profile.

0 Comments

Add Your Comment

Post a Comment

Required fields are marked *

✅ Thanks for adding your comment! It will appear after moderation.

0 Comments

Related Blogs
View All Blogs
Power BI Components
Read More
Connect to Excel Data Source in Power BI
Read More
Creating Scatter Chart in Power BI
Read More
Ohio Computer Academy - IT Training & Vocational Education in Dublin, OH

Registered with the Ohio State Board of Career Colleges and Schools — School Registration No. 2395

About Us
  • Contact Us
  • Our Story
  • Training Gallery
  • Reviews
  • Books
  • Greater Columbus Training Center
Trainings/Services
  • Course Categories
  • Learning Paths
  • Frequently Asked Questions
  • AI Advantage
Contact Us
  • Phone:+1 866-648-7284
  • E-mail: info@ohiocomputeracademy.com
  • Address:

    Dublin, Ohio
    5900 Sawmill Road, Suite # 150, Dublin, OHIO 43017 USA

Thank you
Failed
Free Training Courses
  • Computer Fundamentals for Beginners
  • MS Word for Beginners
  • Microsoft Excel for Beginners
AI Courses
  • Claude Basics
  • Claude Advanced
  • AI for Workplace Productivity
  • Prompt Engineering
  • Agentic AI Solutions
  • AI for Quality Control
Cloud Tech
  • DP-900 Azure Data Fundamentals
  • DP-100 Data Science on Azure
  • AWS Technical Essentials
  • AWS Cloud Practitioner
  • AWS Solutions Architect
DevOps
  • DevOps Essentials
  • DevOps with AWS
  • DevOps with Azure
Dashboarding/BI
  • Tableau Beginner
  • Power BI Beginner
  • Data Analytics with Excel
Database
  • Oracle SQL for Beginners
  • SQL for Analysts
  • SQL Server for Beginners
MS Office & Workplace Productivity
  • Workplace Digital Skills
  • Excel for Finance
  • Excel for HR
  • Excel Beginners to Advanced
  • Workplace Computer Skills
Learning Hub
  • Begin Your IT Career
  • Generative AI & Workplace Productivity Foundations
  • Claude AI Learning Path
  • Data Visualization Foundations
  • Data Analytics Career Path
  • AI for Business & Data Applications
  • Programming Foundations & Development Path

© 2026 Ohio Computer Academy. All rights reserved.

  • Privacy
  • Terms & Conditions