
Microsoft Excel remains one of the most valuable workplace skills across nearly every industry. Whether you work in finance, healthcare, sales, human resources, logistics, engineering, or information technology, Excel is still the preferred tool for organizing, analyzing, and presenting data.
Despite the growth of AI and business intelligence tools, Excel continues to be the foundation for data analysis and decision-making. Professionals who master Excel work faster, make fewer mistakes, and provide more value to their organizations.
In this guide, we'll explore five essential Microsoft Excel skills every professional should learn and explain how these skills improve workplace productivity.
Why Microsoft Excel Skills Are Essential in Today's Workplace
Many people believe Excel is only for accountants or finance professionals. In reality, Excel is used in virtually every department.
Organizations rely on Excel to:
Analyze business performance
Track budgets
Manage projects
Create reports
Monitor sales
Organize customer data
Forecast trends
Support business decisions
Even professionals using Power BI, SQL, Python, or AI tools often begin their work with Excel.
1. Sorting and Filtering Data
The ability to quickly organize large datasets is one of Excel's most important skills.
Sorting helps arrange data alphabetically, numerically, or by date. The Sort option is available in the Home tab of the ribbon. It comes along with the Filter option.
For example, if a sales manager wants see the latest orders, he can sort the orders by latest order date, as shown in the figure below:
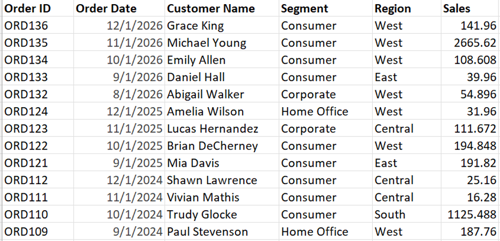
Figure1: Data Sorted by Latest Order Date
Alt text for image: Microsoft Excel data sorted by latest order date using the Sort feature
The Sort option is helpful in arranging names in alphabetical order, organizing the entire data by dates, or ordering numerical values like Sales or Profit in ascending or descending order.
Filtering allows users to display only the information they need. It assists users in focusing on specific data elements within a large dataset.
For example, if sales manager wants to view the orders only from the region West, he can apply filter on it, as shown in the figure below:
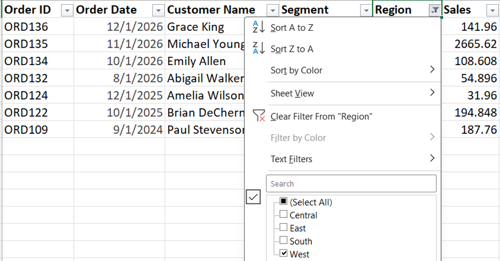
Figure2: Dataset filtered by Region West
Alt Text: Filtering Excel data by Region using the Filter feature
Instead of reviewing the entire dataset, Filters allow to focus on specific or required data.
This simple skill saves hours of manual work.
2. Conditional Formatting
Conditional Formatting automatically highlights important information.
Examples include:
Highlight Pending Payments
Highlight High-value Transactions
Highlight Invoices with Pending Payments
Highlight Overdue payments
Highlight Revenue Category
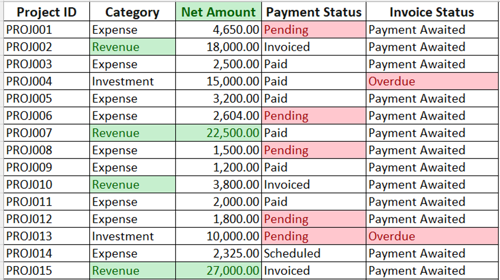
Figure3: Using Conditional Formatting to highlight key data elements
Alt text: Using Conditional Formatting in Microsoft Excel to highlight key data elements
Instead of searching through thousands of rows, Excel immediately identifies important trends.
3. Essential Formulas and Functions
Formulas transform Excel from a spreadsheet into a powerful business tool.
Every professional should understand functions such as:
SUM(). Can be used to calculate Total Sales.
MIN(). Can be used to calculate Minimum Sales.
MAX(). Can be used to calculate Maximum Sales.
AVERAGE(). Can be used to find out the Average Sales.
IF(). Used in logical expressions. For example, to find out if Sales was profitable or not.
SUMIF(). Used to calculate Total Sales based on a condition. For example, Total for Region West.
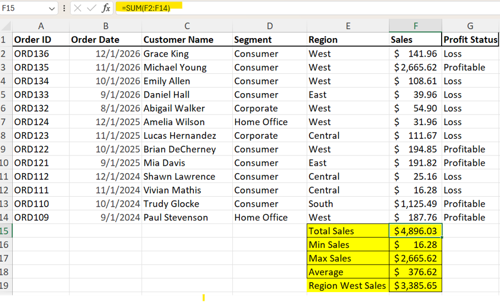
Figure4: Functions in Excel
Alt Text: Microsoft Excel formulas including SUM, MIN, MAX, AVERAGE,IF, and SUMIF
The actual calculation using the function can be seen in the formula bar. These functions automate calculations and eliminate repetitive manual work.
4. Using VLookup Function
Professionals frequently need to combine information from multiple spreadsheets.
VLOOKUP is one of Excel's most widely used functions for retrieving information from another table. Instead of manually searching through hundreds of records, VLOOKUP automatically finds the matching value and returns the required information.
For example, a sheet contains only Customer ID but Customer Name is located in a different sheet or workbook. A Vlookup function will compare the Customer IDs and fetch relevant Customer Names.
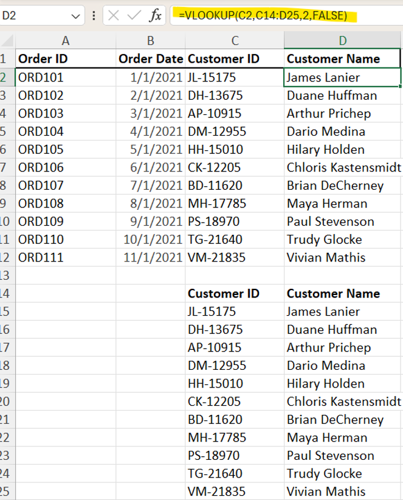
Figure5: Vlookup functions retrieves Customer Names by matching Customer IDs
Alt text: VLOOKUP function retrieving customer names from another Excel table
VlookUp is used to combine data from different sheets.
5. PivotTables
PivotTables are among Excel's most valuable features. They are used to generate
They allow users to summarize thousands of rows of data in seconds.
With PivotTables, professionals can:
Analyze sales
Compare regions
Summarize expenses
Review employee performance
Identify trends
Using the data set shown in Figure4: Functions in Excel, we can create a Pivot Table to show Sales by different Regions
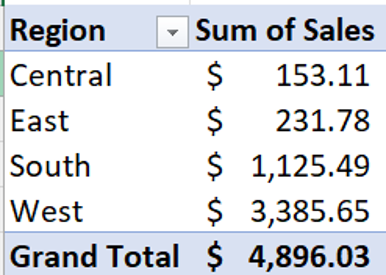
Figure 6: Pivot Table summarizing Sales by Regions
Alt Text: Excel PivotTable summarizing sales by region
Pivot Tables can quickly summarize and aggregate the results avoid the need to go through the entire data set.
6. Charts and Data Visualization
Numbers become easier to understand when presented visually.
Excel includes charts such as:
Column Charts
Bar Charts
Pie Charts
Line Charts
Scatter Charts
Combo Charts
Effective charts help decision-makers understand business performance quickly.
Pivot Charts are a good way to create visualizations. The Pivot Table created in the previous exercise can be used to generate a Pie chart which will show graphically, Region contribution to Sales, as shown in the figure below.
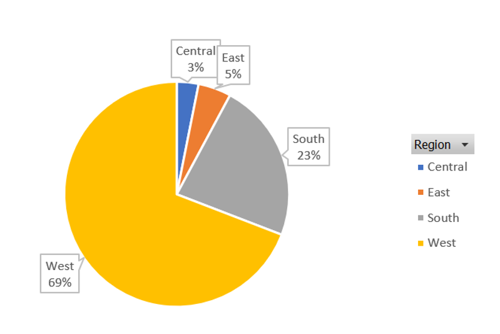
Figure 7: Pie chart displaying Region-wise Sales
Alt Text: Pie chart created from an Excel PivotTable showing region-wise sales
Conclusion
Microsoft Excel continues to be one of the most valuable skills in today's workplace. Whether you're organizing data, performing calculations, analyzing business performance, or creating reports, these five Excel skills can significantly improve your productivity and efficiency.
Learning Excel isn't just about using a spreadsheet—it's about making better business decisions and becoming more valuable to employers.
If you're ready to build practical, job-ready Excel skills, consider joining our Excel Beginners to Advanced training program at Ohio Computer Academy.
To learn more about Microsoft Excel's capabilities and the latest features, visit the Microsoft Excel Help Center.
Learn Microsoft Excel with Ohio Computer Academy
Whether you're a beginner or looking to enhance your existing skills, our instructor-led Excel Beginners to Advanced course helps you learn Excel through real-world projects and hands-on exercises.
You'll learn:
Sorting and Filtering
Conditional Formatting
Formulas and Functions
VLOOKUP and Lookup Functions
PivotTables
Charts and Dashboards
Data Analysis
Productivity Tips
Explore our Excel Beginners to Advanced course today.
Continue Learning Microsoft Excel
Want to see these Excel skills in action?
Watch our Microsoft Excel training videos on the Ohio Computer Academy YouTube channel, where we demonstrate practical Excel techniques, productivity tips, and real-world business examples.
Visit our Microsoft Excel YouTube Playlist
Frequently Asked Questions
1. What are the most important Microsoft Excel skills for beginners?
The most important Excel skills include sorting and filtering data, using formulas and functions, VLOOKUP, PivotTables, and creating charts. These skills are widely used across business, finance, administration, and data analysis roles.
2. Why is Microsoft Excel important for professionals?
Microsoft Excel helps professionals organize data, perform calculations, analyze business information, create reports, and make informed decisions. It remains one of the most requested workplace skills across many industries.
3. Is Microsoft Excel still worth learning?
Yes. Despite advances in AI and business intelligence tools, Microsoft Excel continues to be an essential skill for professionals. Many organizations still use Excel for reporting, budgeting, forecasting, and data analysis.
4. Which Excel function should I learn first?
Most beginners should start with basic formulas such as SUM, AVERAGE, MIN, MAX, and IF before learning advanced functions like VLOOKUP and PivotTables.
5. Where can I learn Microsoft Excel online?
Ohio Computer Academy offers instructor-led Excel Beginners to Advanced training with hands-on exercises, real-world datasets, and practical projects to help learners build job-ready Excel skills.

Chandraish Sinha is the Founder and President of Ohio Computer Academy, a leading institution committed to delivering high-quality IT education. With a passion for teaching and a belief in his company’s mission—Inspire, Educate & Evolve—Chandraish brings over 25 years of experience in the Information Technology industry.
Explore more of his work on his Amazon Author Profile.
0 Comments
0 Comments


Post a Comment