
How to reset filters in Tableau
Filters are a good way to restrict the data displayed on a Tableau dashboard or to view the data, based on the filters selected. But if the number of filters are a lot, it becomes a pain to deselect filter values on multiple filters. In this blog, we will discuss how to reset filters in Tableau dashboards with a single click.
How to reset filters in Tableau
- Create a sheet with a visualization. Select fields to be used as filters.
- Create a new Reset sheet.
- Create a calculation with just a text such as “Reset Filters”.
- Place this calculation on Shape under Marks.
- Select an appropriate shape such as an arrow which will work as a reset button.
- Create a dashboard which will contain the visualization and Reset sheets. Use the floating option to adjust the objects on the dashboard.
- Create a dashboard Action of type Filter. Use Reset sheet as Source and your visualization as the Target Sheet.
- Specify the Target Filters by selecting the fields you want to reset.
How to reset filters in Tableau with example
1. I will first connect to Sample – Superstore.xls. This file is provided by Tableau as a sample data set.
2. From the Data pane on the left, place Region on Rows and Sales on Columns. Place Region on Colors to get distinct colors for each region.
This will create a bar chart or select one from Show Me. Name this sheet as “BarChart”.
3. From the Data pane, select Region, Segment and Category as your filters. Right-click on each and select Show filter. These fields will be displayed as filters on your visualization.
Filters can display Apply button too. Learn how to display Apply button on filters in Tableau.

4. Create a dashboard using the sheet “BarChat” you just created. It will be displayed with the filters you placed on the sheet.
Select floating on each object and place them accordingly on the dashboard.
Select a few filter values for e.g. on Category select Office Supplies and Technology.

You will notice on this dashboard there is no option to reset the filters. You have to deselect and select filter values one by one.
Applying reset filter option on Tableau Dashboards
Now we will apply reset option on the dashboard.
- Create a new sheet and name it “Reset”.
- From the menu, select Create Calculated Field. Name this calculated field as “Reset Filter”. It will contain a simple text calculation
“Reset Filters”
3. Place the calculated field “Reset Filters” on the Shape card under Marks. If Shape is not displayed, select one from the Marks drop-down.
4. Click on Shape card and select a shape you would like to display for your Reset button. I selected the green arrow for this example.
Adjust the size using the Size card.
5. Place Reset Sheet on the dashboard created previously. Make it floating so that you place it next to your filters. Remove the title etc.
Use Actions to create a reset filter Option
Now the final part is to create a dashboard Action to create the reset functionality.
- From the menu, select Dashboard/Actions
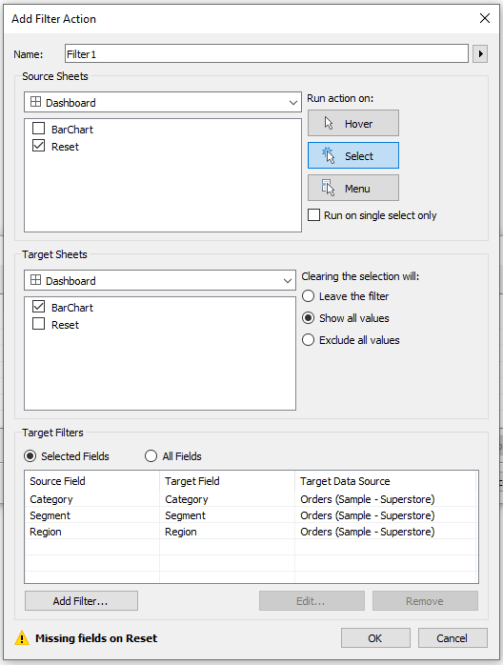
- Add Action of type filter with the following settings.
In the Target Filters, select Add Filter and add the fields for which you want to reset the filters.
You will get a warning “Missing fields on Reset”, you can ignore it.
Using Actions on dashboard
This will conclude all the steps.
Now clicking on the green arrow reset button next to filters will reset all the filters at the same time.
This technique can be used to reset any number of filters.
