Are you interested in enhancing your Microsoft Excel proficiency? This blog presents a series of Excel Basics to Advanced practice questions. The purpose of this article is to provide practice exercises that can be beneficial for readers of the Excel Basics to Advanced book as well as those who haven’t explored its contents . The questions are organized chapter-wise, starting with Excel fundamentals and gradually progressing to more advanced topics.
Feel free to contact us for MS Excel Training.
New to Excel? Watch our Free Excel for Beginners Playlist on YouTube to get started with step-by-step video tutorials.
Chapter1. MS Excel Fundamentals.
Ques1. How you will customize a tab in the ribbon?
Ques2. What option should be selected to keep specific area of the worksheet visible while scrolling vertically or horizontally.
Ques3. Refer to the dataset below, what options should be selected to view only the data where Segment = Home Office

Chapter2. Formatting in Excel.
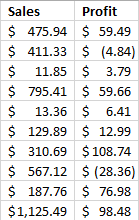
Ques4. Refer to the Sales values below. What option should be selected to display Sales > 500 in yellow. The resulting values should appear the way it is shown in the output.

Output. After implementing the solution, the output should appear like the one below:

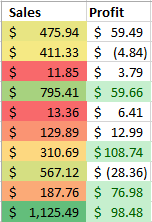
Ques5. Refer to the Sales and Profit amounts given below. Display a scorecard to depict Low, Medium, and High Sales. Also display the Profit > 40% in Green. Your solution should match the provided output.
Output. After implementing the solution, the output should appear like the one below:
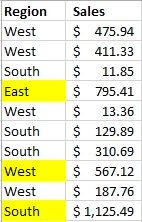
Ques6. Refer to the dataset below. Color the Region in Yellow where Sales > 500.

Output. After implementing the solution, the output should appear like the one below:
Chapter3. Introduction to Formulas.
Ques7. When Autofill is performed, does Excel uses Relative referencing or Absolute referencing?
Ques8. Refer to the dataset below. The data contains Courses, Enrolment, Fee, Discount and Final fee. If enrolment occurs on the “Same Day”, an early bird discount of 10% (Cell D1) is applied.
Discount and Final Fee need to be calculated.
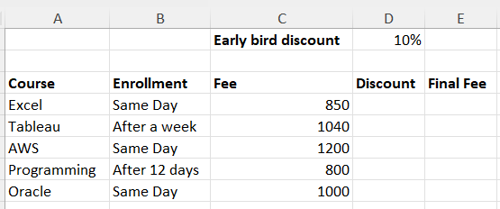
To calculate Discount, a formula is written in Cell D4 =IF(B4=”Same Day”,C4*D1,0). This formula is then auto filled in all the subsequent cells of column D.
This formula produces an error. (see below)

Explain why this error has occurred and how to fix this error. The correct output should appear like the one shown below:

Chapter4. Logical Functions.
Ques9. In what scenarios Logical functions are used in Excel.
Ques10. Our dataset contains Courses, Enrolments, and Timings. Each course has a different timing and it should be displayed for each of the course using Nested IF formula.
Excel timings are 10am – 12pm, Tableau timings are 12pm-2pm, AWS timings are 2pm-4pm, Programming timings are 4pm – 6pm, and Oracle timings are 6pm-8pm.
Write a Nested IF formula in Cell C2 and autofill it to get the timings for all the other courses. The output should match the one shown below:

write the same formula using the IFS function and provide comments on which one is easier to use and understand, Nested IF or IFS.
Chapter5. Text Functions.
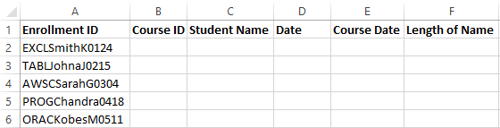
Ques11. Refer to the dataset below. It contains Enrolment ID, which is a combination of Course ID, Student Name, and Date.
In the Course ID column, display four characters of Course ID, In column Student Name display six characters of Student Name, and in the Date column display the Dates. In column Course Date, combine Course ID and Date. In the Length of Name column, calculate the Length of Student Names.
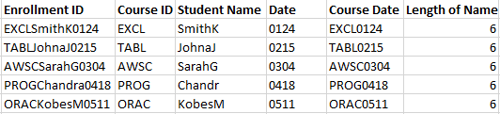
Output. After implementing the solution, the output should appear like the one below:
Chapter6. DateTime Functions.
Ques12. Refer to the dataset below.
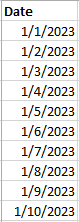
Add 7 days to the above date, add 4 months to the date, and calculate the Number of Working days between two date and Date + 7 columns.
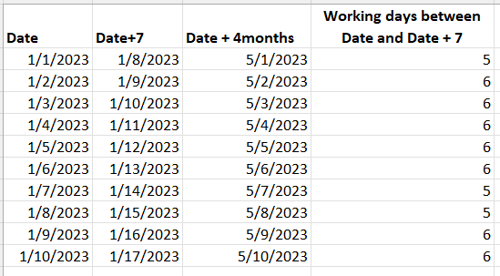
Output. After implementing the solution, the output should appear like the one below:
Chapter7. Mathematical Functions.
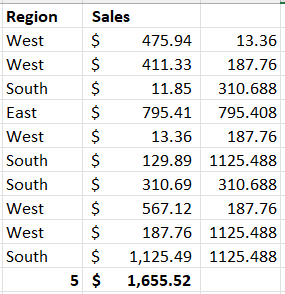
Ques13. Refer to the Region and Sales values in the dataset below. Calculate the count of cells where Region = West and find the sum of Sales where Region = West.
The output should be as shown in the figure below i.e., Count is 5 and sum of Sales of $1,655.52:
Chapter8. Lookup and Reference.
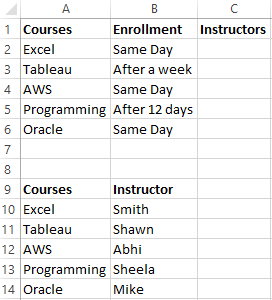
Ques14. Refer to the dataset below, which comprises of two ranges. One range includes Courses, Enrollment, and an empty column for Instructors. The other range contains Courses and their corresponding Instructors. Write the VLOOKUP function to populate the values in the empty Instructor column by searching for values in the second range.
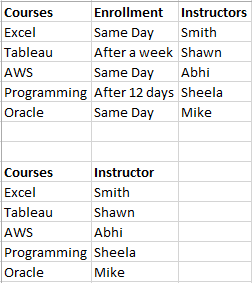
Output. After implementing the solution, the output should appear like the one below:
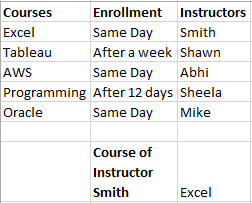
Ques15. Refer to the dataset below. Which function should be employed to find the Course associated with the Instructor = Smith?
The dataset and the output are provided below:
Chapter9. Pivot Tables and Charts.
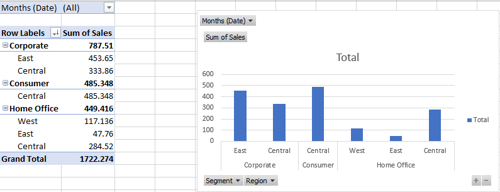
Ques16. Refer to the dataset below. Create a Pivot table and chart as shown in the output.
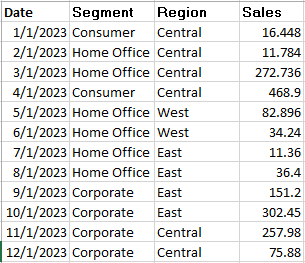
Output. After implementing the solution, the output should appear like the one below:
Chapter10. Excel Tables.
Ques17. What is the advantage of using an Excel Table.
Ques18. What is the difference between Subtotal and Sum functions.
Chapter11. Introduction to Excel Macros.
Ques19. In which scenarios Excel Macros are used.
Ques20. How to modify the visual basic code for Macros

Chandraish Sinha is the Founder and President of Ohio Computer Academy, a leading institution committed to delivering high-quality IT education. With a passion for teaching and a belief in his company’s mission—Inspire, Educate & Evolve—Chandraish brings over 25 years of experience in the Information Technology industry.
Explore more of his work on his Amazon Author Profile.


Post a Comment